Excel Skills
As a data analyst with practical Excel skills, I use spreadsheets to organize data and create insightful visualizations. Here's an overview of my Excel capabilities:
1. Data Visualization
- Creating various types of charts (bar, line, pie, etc.)
- Pivot Tables and Pivot Charts
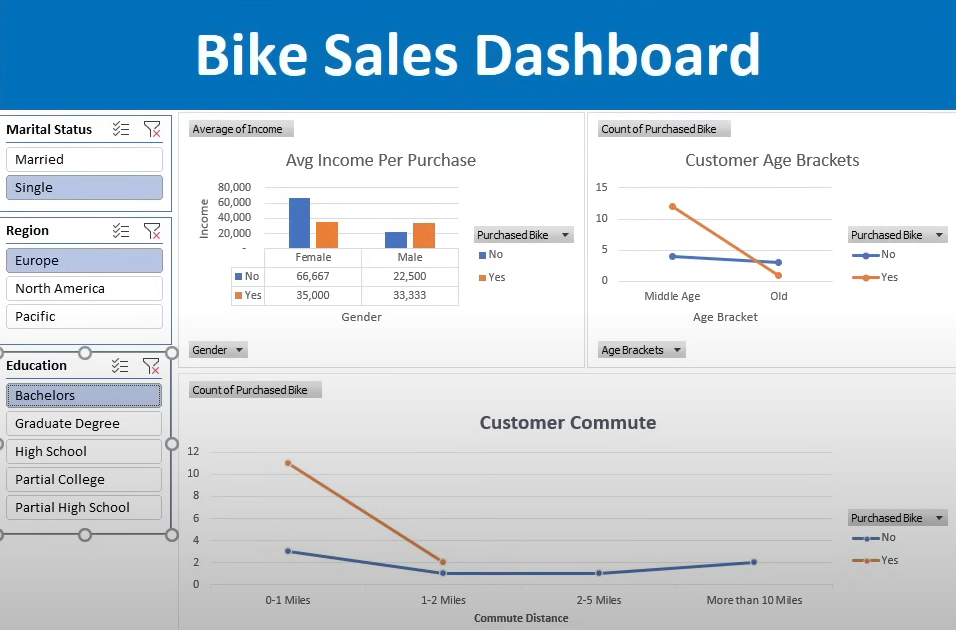
Example: Created a monthly sales dashboard using Pivot Tables and Charts to visualize sales performance across different product categories. This allowed the sales team to quickly identify top-selling products and trends.
2. Data Lookup and Validation
- VLOOKUP and HLOOKUP for data retrieval
- Data Validation for controlling input
Example: Implemented VLOOKUP functions to automatically populate product details (price, category, supplier) in an order form, reducing manual data entry errors. Used Data Validation to create drop-down lists for product selection, ensuring data consistency.
3. Data Cleaning and Formatting
- Remove Duplicates for data cleansing
- Custom formatting for improved readability
- Conditional formatting to highlight important data
Example: Cleaned a customer database by removing duplicate entries, standardizing formats (e.g., phone numbers, addresses), and using conditional formatting to highlight high-value customers. This improved the accuracy of our customer communications and targeting.
